The following is a guest post by Carl Fleischhauer, a Project Manager in the National Digital Initiatives unit at the Library of Congress.
It’s not for everyone, but I enjoy trying to figure out specialized technical terminology, even at a superficial level. For the last month or two, I have been helping assemble a revision of a FADGI guideline (PDF) and an accompanying explanatory report (PDF). Both of these documents pertain to measuring the performance of analog-to-digital converters (ADC) for sound recordings; you can find them and other relevant documents at a dedicated FADGI Web page. This experience has let me peer into the world of audio engineering. (FADGI stands for the Federal Agencies Digitization Guidelines Initiative; there are two Working Groups, one for still images, one for audio-visual.)

If you are familiar with audio digitization, some of the terms will come easily and are even self-explanatory: frequency response (what are the highest and lowest sound pitches that can be reproduced without having the level or volume fall out of range?), total harmonic distortion + noise (has to do with, well, distortion and noise, stuff you don’t want in your audio stream), and two types of crosstalk (for stereo, you want to keep left separate from right). Among the terms that were a little more mysterious to me was common-mode rejection ratio. I learned that this has to do with the ability of a device to reject noise and interference that typically results from picking up unwanted electromagnetic interference in the wiring between the audio source and the ADC’s input.
My favorite mystery terms consist of this pair: sync input jitter susceptibility and jitter transfer gain. For a layperson, the word jitter is irresistible. Alas, even with audio at stake, this has nothing to do with music or dance. Rather, the term reflects the importance of a “clock.” As discussed in the sidebar that follows, digitization entails sampling the audio, producing a large number of numbers (the digits, natch) at very precise intervals in time, aka “event instants.” One Audio Engineering Society standard (AES-12id-2006, r2011) defines jitter as “the dynamic deviation of event instants in a stream or signal from their ideal positions in time.” Accuracy and precision are at stake. Continued below sidebar.
SIDEBAR: Audio digitization and what an ADC does
One way or another sound starts as waves, first in the air and (if being recorded) subsequently transformed into changes in voltage that march in step with the waves in the air: “electrical waves.” In the not-so-old days, these waves were recorded on tape, where magnetic particles made a record of the voltage changes, more or less a magnetic “analog” of the electrical waves.
Those not-so-old tapes deteriorate as time passes, and several FADGI-member agencies are actively copying them in order to save their recorded content. The content is transferred to digital files, i.e., digitized. The ADC is the central device in the digitizing system, where it transforms the (electrical) waves it receives into a stream of digits that represent points on the wave. (If you are imagining a game of connect the dots, you are not too far off.)
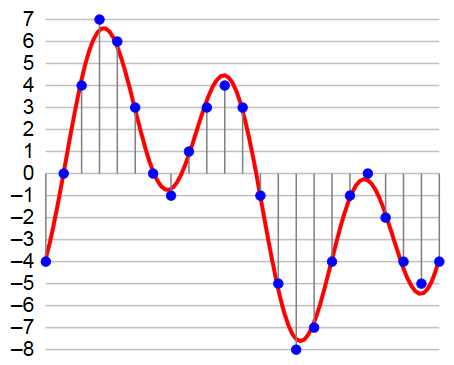
Most preservation specialists recommend that the waveform be sampled 96,000 times per second, i.e., 96 kiloherz (kHz) in tech-speak. This high number will do a dandy job capturing the “horizontal” frequency of the wave movement. And in order capture the amplitude, the “vertical” movement, each sample should be represented by a number (to position it on the graph, as it were) that is 24 bits long. For comparison, the bits-per-sample on an audio compact disk is only 16 bits per sample, with a sampling frequency of 44,100 per second. Audio CDs are less “hi-fi” than the files made to serve preservation goals.
The point of the preceding is this: an ADC must produce 96,000 reliable data points (samples) each second, each sample accurately represented by a 24-bit-long number. That is quite a trick. And when you add things like having to cope with stereo (two-channel) audio, and other vagaries of the overall setup, the trick becomes even more challenging.
Continuation of text from above sidebar.
The FADGI report, released this month, is one product from a multiyear project that saw an initial guideline published in 2012. The new report describes activities carried out during 2015, some of which have led to proposed adjustments to the 2012 guideline. Meanwhile a fresh round of work begins in 2016. The main author is the Working Group’s expert consultant Chris Lacinak of Audiovisual Preservation Solutions, supported by the audio maintenance technician Phillip Sztenderowicz. Field tests were carried out at three federal agencies: the Voice of America, the National Archives and Records Administration, and the Packard Campus of the Library of Congress. The FADGI team is eager to hear from specialists in the field, and encourages review and comments, with a due date of May 30, 2016.
Determining the metrics and methods for ADC performance testing has proven to be challenging, and this progress report takes its place in a series of documents, all linked to the web page cited above. Why challenging? There are two broad dimensions to the effort, each difficult to properly define and, as it happens, the dimensions can intersect in unanticipated ways.
One dimension entails some expected parameters:
- What features or capabilities of the ADC ought be measured?
- How should those features or capabilities be measured?
- What ought be the pass-fail points for preservation work?
The second dimension reflects the Working Group’s interest in allowing for levels of performance. The 2012 guideline pertains to ADC performance at the highest level. From the start, however, the Working Group also sought to develop guidelines for moderate or minimum levels of performance as well. Such levels might be selected by organizations with modest resources but who wish to proceed with a digitization project, e.g., a federal agency with a historical collection of recordings of lecture-like presentations by staff, originally recorded on audiocassettes. The agency may determine that copies made with a “very good” ADC will meet every conceivable future need. Or an archive may have certain classes of material, e.g., radio station logging tapes, for which “acceptable” digitized copies produced with a minimum performance system will be sufficient.
This second dimension also plays off another factor: the cost of testing equipment, and the skill level required to use it. The high-level ADC performance guideline contains 12 metrics, several with very exacting measurements. In order to evaluate performance against all 12 metrics at the desired levels of precision, an organization will need an audio analyzer from a category that costs upwards of $20,000. Several large federal agencies possess such devices (two participated in a 2015 FADGI field test) but many others do not, and the cost is prohibitive for many of them.

As described in the new report, the matter of sorting out the metrics and methods for the high-level performance guideline are largely a matter of refinement. (A set of minor adjustments is proposed in the new documents posted this month.) But it was difficult to chart a course toward the goal of a lower-cost, lower-skill-requiring guideline.
The difficulty has to do with the intricacies of measuring audio performance, and the ways in which the specific measurement tools–high cost, low cost–execute the measurements, also known as test methods. A low-cost system may provide a reasonable assessment of, say, Total Harmonic Distortion + Noise (THD+N), but it does not do so in precisely the same manner as the high-cost measurement system. Thus, although both systems offer a measurement of THD+N, and although the low-cost system’s ability to measure that performance “tops out” at a lower quality level than the high-cost system, it is not strictly the case that there is a simple “lower performance number” relationship when compared to the reading from the high-cost system. It is also the case that the low-cost system itself has limited capabilities. The ADC being tested might perform better than what the low-cost system reports, due to the testing system’s limitations. However–and this is important–a low-cost test system will ferret out clear performance failures from an ADC, even if it is a high-performance unit.
One outcome of the 2015 project is the conceptual framework represented in the table that follows. This framework uses terms to name the test systems that reflect both of the elements in play: ADC performance and measurement system cost.
